Price Check in Early 2026

By Ben Dolan, CFP®
This week I sent out some amazing news to clients and friends of DCA. My partner, Michael, and his wife Grace, welcomed a baby boy into the world in early January. I’m elated for them! As all of us lucky enough to be parents know, welcoming a child into the world is a pivotal moment in our lives, and the emotional whirlwind of this miraculous occasion can be a lot to deal with.
When the dust settles and you start getting into the groove of parenting, another whirlwind begins…the financial cost of children (queue different emotions). A quick Google search relayed that, over 18 years, the cost to raise a child for a middle-income family in the US is $297,000 to $332,000 excluding college. Michael is already a thrifty guy, but I’m expecting him to reach a new level of price sensitivity with a new baby around.
Just like with everyday purchases, price matters when it comes to investing. And given the enormous gains in US equity markets over the past three years, pushing household net worth higher, you might be wondering if markets are running too hot, or even in bubble territory. So, perhaps it’s time for a quick price check?
Thanks to our friends at mulpl.com, below is a 50-year review of the trailing twelve-month price-to-earning ratio (or p/e = stock price/earnings per share) of the S&P 500, which sits at 31.34 as of 1/16/26. For context, the average p/e ratio for the 50-year period in the chart is 16.2. This means that investors are paying much more for each dollar of earnings than they have in the past. In other words, the S&P 500 is expensive from a historical standpoint (though not as expensive as in the tech bubble or during the great recession when earnings briefly plummeted).
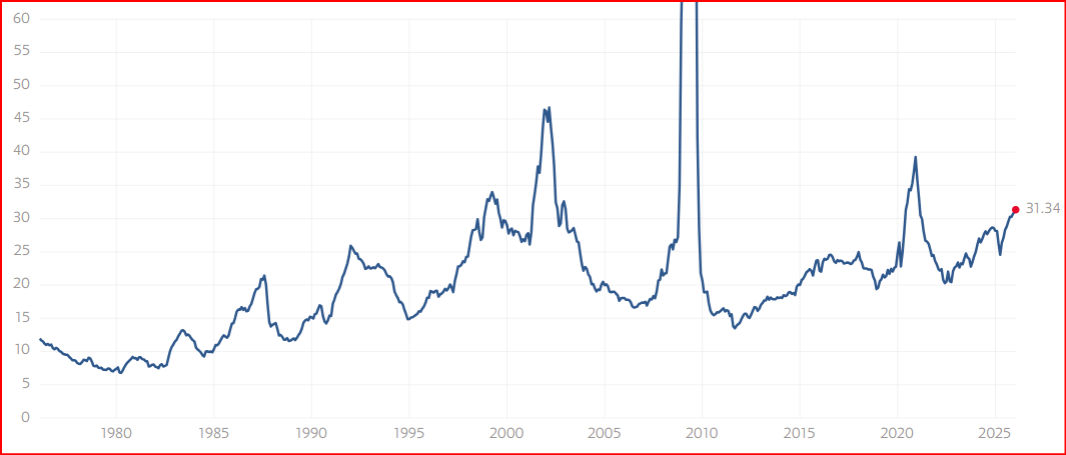
But this chart doesn’t tell the whole story. The S&P 500, while important, is only one component of the overall opportunity set in equities (and has become increasingly concentrated in a small number of very large companies). There are thousands of companies to invest in outside the US Large Cap. I asked Perplexity to provide me with the p/e rations of various indexes outside of the S&P 500, like the Russell 2000 (US small cap index), the S&P Midcap 400, and the MSCI International Developed index. The result is p/e ratios that are much more digestible compared to the S&P 500:
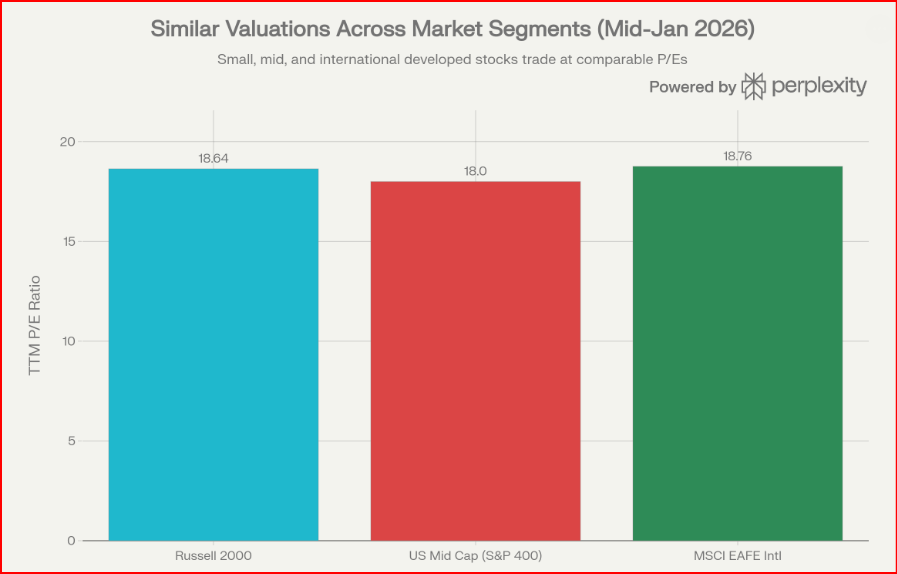
Investors are already favoring these less expensive opportunities in 2026. For example, Heather Gillers, in a blurb for the WSJ over the weekend, reviewed the blistering start for the Russell 2000 in just a couple weeks in January. Year-to-date, she notes, “the Russell is up 7.8%, compared with gains of less than 2% for the Nasdaq and S&P.”

Many investors miss out on these corners of the equity market because they don’t get the big headlines, or they don’t know where to look. But I continue to hold them in my portfolio, and in those of my clients as well. AI continues to dominate the headlines, and especially OpenAI, the team behind ChatGPT.
Speaking of OpenAI, they were recently valued at ~ $500 Billion in October of last year making it the most valuable private company in the world (shares offered on a secondary market were selling 38 times its projected $13 Billion revenue). That’s quite a price for a company that may have lost as much as $9 Billion for calendar year 2025.
The opinions voiced in this material are for general information only and are not intended to provide specific advice or recommendations for any individual. The market and economic data are historical and are no guarantee of future results. All indices are unmanaged and may not be invested into directly. The information in this report has been prepared from data believed to be reliable, but no representation is being made as to its accuracy and completeness.
Nothing in this material should be construed as investment advice offered by Dolan Capital Advisors, Inc. This market commentary is for informational purposes only and is not meant to constitute a recommendation of any particular investment, security, portfolio of securities, transaction, or investment strategy. No chart, graph, or other figure provided should be used to determine which securities to buy, sell or hold. No representation is made concerning the appropriateness of any particular investment, security, portfolio of securities, transaction, or investment strategy. You should speak with your own financial professional before making any investment decisions.
Past performance is not indicative of future results. Dolan Capital Advisors, Inc. does not guarantee any specific outcome or profit. These disclosures cannot and do not list every conceivable factor that may affect the results of any investment or investment strategy. Risks will arise, and an investor must be willing and able to accept those risks, including the loss of principal.
Certain statements contained herein are statements of future expectations and other forward-looking statements that are based on opinions and assumptions that involve known and unknown risks and uncertainties that would cause actual results, performance, or events to differ materially from those expressed or implied in such statements.
Ben Dolan and Michael Foster are investment advisor representatives of Dolan Capital Advisors, Inc., a SEC-registered investment adviser. Investment advice offered through Dolan Capital Advisors, Inc.